
•
article
 •
•
2 min read
The business of fundraising is always changing, but the best ways to get a handle on the tactics and practices needed to adapt is by understanding the driving force behind these changes — donor behaviour.
We’ve compiled some of the most important stats to put numbers behind these behaviours so you can start planning your own successful fundraising strategy.
-79% of people use a credit card for recurring donations, and over 50% of the population will be cashless by 2020. With digital donations making up a larger portion of your organization's revenue, it’s important to find a donation processing provider with low transaction rates and simple billing.
.png?width=529&name=pasted%20image%200%20(2).png)
Source: Paystone
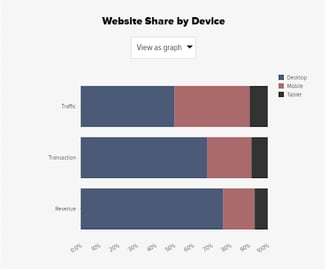
-Mobile devices account for 25% of online giving.
-Mobile traffic accounted for 40% of nonprofit website visits, however, desktop users accounted for 76% of revenue.
Source: M+R
-Online donations aren't just for the younger generation, in fact, 47% of donors over the age of 60 give online, while the average overall donor age is 54.

Source: Paystone
-85% of donors prefer to be thanked through email and say it would influence them to give again. The importance of this email of communication means it essential that your donation platform provides you with access to your donor’s email lists.
-Email revenue accounted for 28% of online giving, and the average cost to acquire an email or phone number lead via digital advertising is 1.46$
-The cost of acquiring a donation via social media ads, however, is $41 and a whopping $204 via display ads.
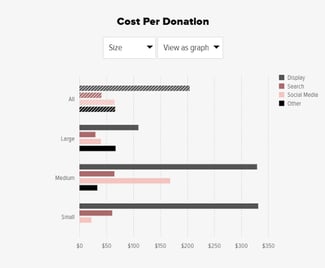
Source: M+R
-Donations made on a branded donation form are, on average, 38% larger than contributions made through a generic PayPal page.
-December is the most popular month for giving and accounts for 35% of all giving.
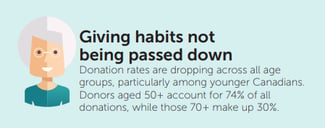
-35-44-year-olds are most likely to give, but those who are 65-years-old and above have the largest average donation amount.
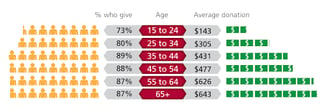
Source: Imagine Canada
-Canadian women are slightly more likely to give to a charity than Canadian men.
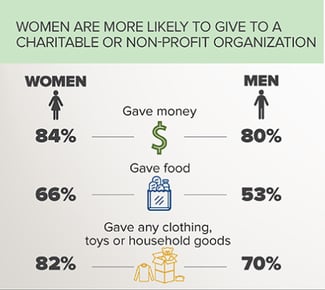
Source: Stats Canada
Of course, it’s important to keep in mind the organization and initiative will have an impact on whom it appeals to. If your organization uses Facebook ads manager, you can also use the demographics section within your campaigns to determine whom your ads are resonating with.
-Donation rates are decreasing among younger Canadians, while, those individuals who are new to Canada are giving more than the average donor born in Canada.
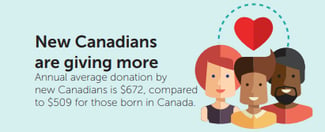
Source: Imagine Canada
-72% of all donations are made by individuals, 15% are made by foundations, and 5% are made by corporations.
While securing large gifts from corporate partners is an important goal for charities, this stat proves that engaging the average individual donor has a big return on investment.
We hope this information provided you with actionable insights to grow your fundraising. Remember, capitalizing on credit and debit donations and engaging your audience through social and email will help create a sustainable future for your organization.
If you want ideas about how to grow your fundraising, check out our e-commerce and social media tips for fundraising!